
Andrew Hong, Washington Community Alliance
Redistricting Map Plans: Kent City Council Redistricting
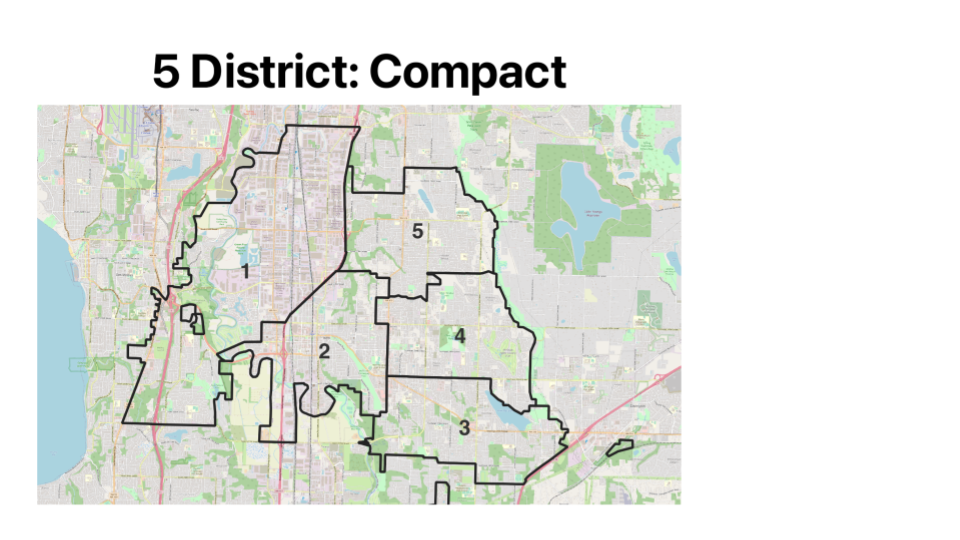
We assembled six different Kent City Council map proposals—three 5-district maps and three 7-district maps—to measure possible effects of single-member districts (SMD) on Kent city council elections and composition. For each of the two types of maps (5 vs 7 districts), one map sought to maximize compactness, one map sought to maximize the number of majority-minority districts, and one map sought to maximize the number of majority-minority districts by eligible voters (citizen-voting-age population, or CVAP). The intention behind the latter two map plans was to highlight the potential SMDs had for communities of color to get more proportional representation in Kent. The “compact” map proposals strictly complies with state and federal legal requirements and better reflect potential maps that would be enacted by an independent redistricting commission. Finally, we compared the measured outcomes of SMDs compared to another electoral system, proportional ranked-choice voting (PRCV).
Single Member District System vs Status Quo
- Single member districts allow for more proportional representation in Kent City Council. This is because while one political coalition can win citywide in Kent by just 51% in each 7 council seat contest, that coalition could win all 7 at-large seats despite being favored by just half of voters. Districts help solve this problem because it allocates 1 council member per 1 district for 5 or 7 total districts—you can’t just win 51% of the citywide vote and win every seat, you need to win 51% in each district. Because different neighborhoods and districts vote differently by nature, it allows for more proportional political, racial, and socioeconomic representation in Kent City Council that better reflects Kent’s diverse voters.
- We see that a district-based system in Kent would slightly favor progressive candidates supported by communities of color more than the status quo just because of the structure of a single-member district based system. This is because districts—each of which elects 1/7 of the council—are drawn to have equal population, not equal eligible voters, or especially, odd-year election voters. Communities of color tend to have less citizens and adults over 18 years-old, thus have less eligible voters in elections. Communities of color also tend to have lower voter turnout and voter registration rates, which compound to amount to vast electoral underrepresentation compared to affluent white communities. We see this materialize in recent Kent City Council at-large elections where affluent, majority-white District 5 (see 7-Compact Map) had far more voters than other districts, namely lower-income, majority-BIPOC districts. The current at-large system enables District 5 voters to play an outsized role in the elections of city council.
- For example in 2021 City Council Position 4 (Cliff Cawthon vs Toni Troutner), there were 3,981 votes cast in District 5 compared to 3,387 in the next closest district (District 7) and 1,996 in the lowest-turnout district (District 2). The median district turnout was a total of 2,646 votes, which is 66% of District 5’s turnout or 1,335 fewer votes. So of the 19,326 votes cast in this contest across the City of Kent, 20.6% of the votes came from District 5 despite only being 14.3% (1/7) of the population. Meanwhile only 10.3% of the votes (half as many as District 5) in this contest came from heavily-working class BIPOC District 2.
In a 7-district system, District 5 voters will only be able to vote for the single District 5 council member instead of all seven at-large council members—as will every other district. District 5 voters will no longer encompass twice as much of the electorate that elects the City Council compared to District 2—they will only elect 1/7 council members.
- For example in 2021 City Council Position 4 (Cliff Cawthon vs Toni Troutner), there were 3,981 votes cast in District 5 compared to 3,387 in the next closest district (District 7) and 1,996 in the lowest-turnout district (District 2). The median district turnout was a total of 2,646 votes, which is 66% of District 5’s turnout or 1,335 fewer votes. So of the 19,326 votes cast in this contest across the City of Kent, 20.6% of the votes came from District 5 despite only being 14.3% (1/7) of the population. Meanwhile only 10.3% of the votes (half as many as District 5) in this contest came from heavily-working class BIPOC District 2.
- So just by structure, single-member districts equal the playing field in terms of electoral representation by ensuring lower-income, BIPOC communities in Kent that face additional barriers to the ballot box get fairer, more proportional representation in Kent City Council.
SMD Map Plans
- See these slides for a complete overview of each map proposal and associated data per district by race, income, renter composition, and political outcomes of the following contests (all of which progressive candidates lost to conservative candidates by varying margins):
- 2017 City Council Position 4
- 2019 City Council Position 3
- 2019 City Council Position 5
- 2019 City Council Position 7
- 2021 City Council Position 4
- In general, the 7-district map performs better for progressive candidates compared to the 5-district maps. There are negligible political outcome differences between the 7-district map plans.
- The 5-district maps (5 district council members + 2 at-large seats) generally yielded worse results for progressive candidates (of the contests measured). There are negligible political outcome differences between the 5-district map plans.
- In general, every district was majority-BIPOC except for District 5 in the 7-Compact map proposal. Most districts were between 55-65% BIPOC.
- In general, every district was majority-renter except for District 5 in the 7-Compact map proposal and District 4 in the 5-Compact map. Most districts were between 65-75% renter.
- In general, every district was very working class with a median income between $20,000-30,000 with some exceptions above and below that range.
- Tye Whitfield (progressive candidate) would have won 0 districts in any map.
- Hira Bhullar (progressive candidate) would have won 1-2 districts in 7-district maps and 0-2 districts in 5-district maps—his best performance was in the 5-CVAP map where he won 2/5 districts.
- Mizan Rahman (progressive candidate) would have won 0 districts in any map.
- Awale Farah (progressive candidate) would have won 0 districts in any map.
- Cliff Cawthon (progressive candidate) would have won 0-1 districts in 7-district maps and 0 districts in 5-district maps—his best performance was in the 7-Compact and 7-CVAP maps where he won 1/7 districts.
Proportional Ranked-Choice Voting
- It’s important to note another alternative voting system that would have yielded better results for progressive candidates with support from BIPOC communities: proportional ranked-choice voting (PRCV). Due to the relative lack of geographic segregation by race and political ideology in Kent, single-member districts do not consistently yield exactly proportional results in Kent City Council elections; you can’t draw many distinctive “progressive” districts and “conservative” districts because progressive and conservative voters are scattered relatively equally across the entire city for the most part. This means whoever loses a citywide election generally—even by just a few hundred votes—generally wins just 1 or 2 districts (which is better then 0 seats, which is won under the status quo). For example, Cawthon received 43% of the vote in the 2021 City Council Position 4 contest, but would have only won 1/7 districts. Proportionally, he should have won 3/7 seats, and he would have under PRCV. He won 0/7 seats in the status quo.
- In addition to City Council Position 4’s contest, here is how PRCV would have translated into seats for each contest:
| Contest | Progressive Vote | Est. Districts Won (7) | PRCV Outcome |
| 2017 Position 4 | Whitfield 36.7% | 0 | 2 |
| 2019 Position 3 | Bhullar 47.6% | 1-2 | 3 |
| 2019 Position 5 | Rahman 34.1% | 0 | 2 |
| 2019 Position 7 | Farah 41.3% | 0 | 3 |
| 2021 Position 4 | Cawthon 43.5% | 1 | 3 |
- Another quirk of PRCV is that it would drastically narrow the possible political composition of the council indefinitely; it would raise the “floor” (minimum number of seats) progressives would win and lower the “ceiling” (maximum number of seats) progressives would win. The vast majority of the time, that range ends up being 3-4 seats of the 7 total—so progressives would rarely win fewer than 3 seats and rarely win more than 4 seats. A coalition would have to win >62.5% (5 / (7+1) ) of the vote to win more than 4 seats under PRCV.
- In conclusion, PRCV benefits the political minority more than at-large and single-member districts in Kent elections, and thus narrows the ability for any political coalition to win a large majority on the council.
Other considerations
- Council member geographic diversity. A district system requires there to be one council member from each district. This would enforce greater geographic diversity on the council, assuming there is not already one council member per district. This would have benefits for poorer communities who generally lack the resources and political power to run and elect candidates from their neighborhood to citywide office.
- Increased opportunity for low-income candidates. Decreased size of electorate yields lower costs of campaigns, which helps working class candidates. When you run for city council in an at-large system, you must run a citywide campaign across all of Kent’s 135,000 residents. This is far more costly than running in just one district 1/5 or 1/7 that size, which opens opportunities for more working class candidates to run viable campaigns.
- Greater community organizing power. The reality of smaller jurisdictions and electorates also increases the power of community organizing in elections, as you can much more easily reach every voter in your district than across the whole city of Kent. This will naturally help campaigns who have more field operations and incentivize campaigns and candidates to be more active in their district and talking directly to voters.
- Emphasis on neighborhoods. Dividing the city council into 5 or 7 districts means every district-elected council member is elected by a smaller set of neighborhoods and is held accountable by a smaller set of neighborhoods. This ensures more localized, neighborhood-based representation and legislation in the city council and less focus on issues concerning wealthy or business interests.
- Political feasibility. Compared to PRCV, single-member districts are both more easily-understood and more familiar with voters. Every single American is represented in the US Congress under a single-member district system, so the structure is familiar and easy to grasp compared to PRCV, which is only used in a couple jurisdictions in the US. PRCV is much more complex and a bigger change from the current system, thus is far less likelier to win a majority support in either city council, the Kent electorate, or the courts.
Data Sources
Methodology
Districts were drawn at the census block level in Dave’s Redistricting App. Precinct election results from the 5 used contests were geospatially joined by their centroids to the encompassing district shape to then aggregate precinct results by district. This was repeated for each of the six map plans to get election results by district. While this is not an exact estimate, it is as close as we can get. Not every precinct could be precisely joined to each district since some precinct shapes were changed from year-to-year and others were split into multiple districts so district map plans could fully comply with federal equal population requirements for redistricting. This same process was used for 2020 ACS Census data on rentership and median household income by Census Block Groups, and at a Census Block level for racial demographics. To calculate median household income per district, I took the weighted average of all the block groups in each district, weighted by the population per block group. So the “median household income” per district is more accurately described as the “averaged median household income”.